Average wages by county (map)
Average Wages, 1980
Inflation-Adjusted to 2022 Dollars
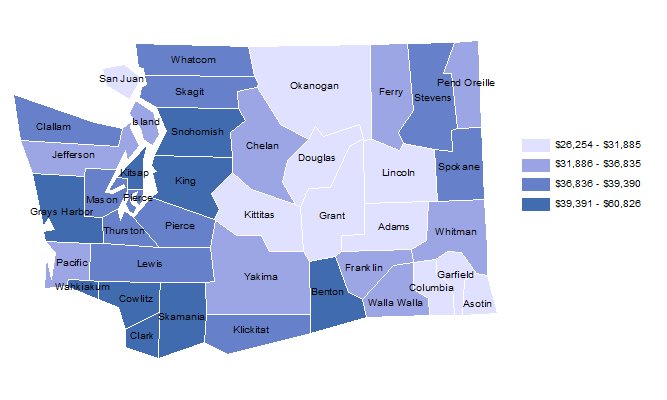
- In 1980, the average wage for Washington state was $46,652 (inflation adjusted to 2022 dollars).
- Garfield and San Juan counties had the lowest average wages at $28,917 and $29,814, respectively.
- Skamania County had the highest average wage at $66,996 because of the high construction wages at the North Bonneville Dam project.
- Seven counties had average wages higher than the state average.
Average Wages, 1990
Inflation-Adjusted to 2022 Dollars
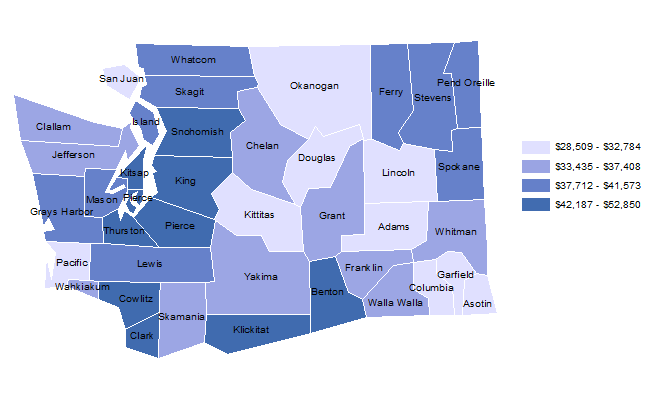
- In 1990, the average wage for Washington state was $46,088 (inflation adjusted to 2022 dollars).
- Columbia and Douglas counties had the lowest average wages at $28,509 and $28,809, respectively.
- King County had the highest average wage at $52,850.
- Four counties had average wages higher than the state average.
Average Wages, 2000
Inflation-Adjusted to 2022 Dollars
- In 2000, the average wage for Washington state was $61,222 (inflation adjusted to 2022 dollars).
- Okanogan and Pacific counties had the lowest average wages at $36,362 and $36,045 respectively.
- King County had the highest average wage at $81,394 and was the only county with average wage higher than the state average.
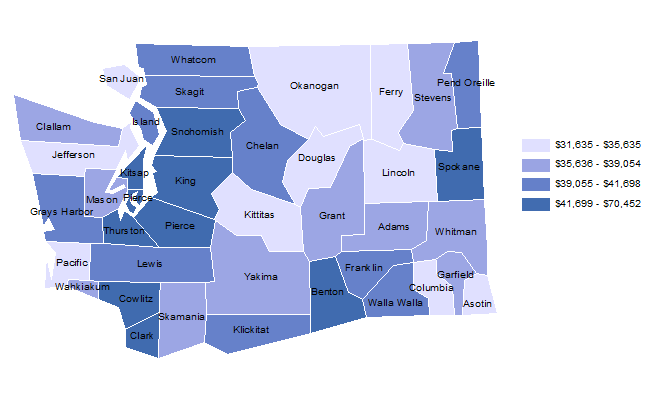
Average Wages, 2010
Inflation-Adjusted to 2022 Dollars
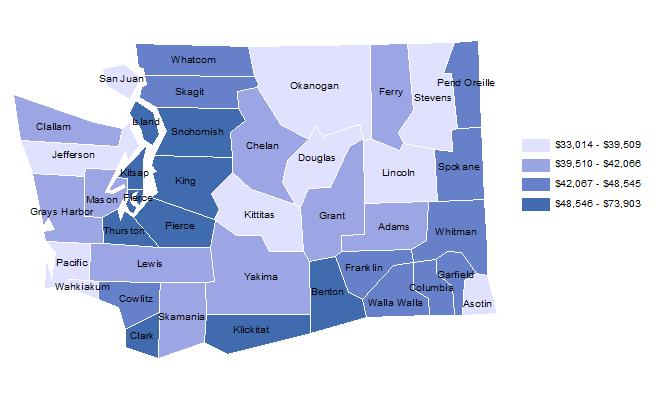
- In 2010, the average wage for Washington state was $65,603 (inflation adjusted to 2022 dollars).
- Okanogan and Asotin counties had the lowest average wagesat $33,014 and $39,310, respectively.
- King County had the highest average wage at $73,903.
- King County and Benton County ($67,065) were the only counties with average wages higher than the state average.
Average Wages, 2022
Inflation-Adjusted to 2022 Dollars

- In 2022 the average wage for Washington state was $83,655.
- Okanogan and Wahkiakum counties had the lowest average wages at $43,048 and $43,045 respectively.
- King County had the highest average wage at $114,693. No other county had an average wage at or above the state average.
Change in Average Wage, 2010-2022
Inflation-Adjusted to 2022 Dollars
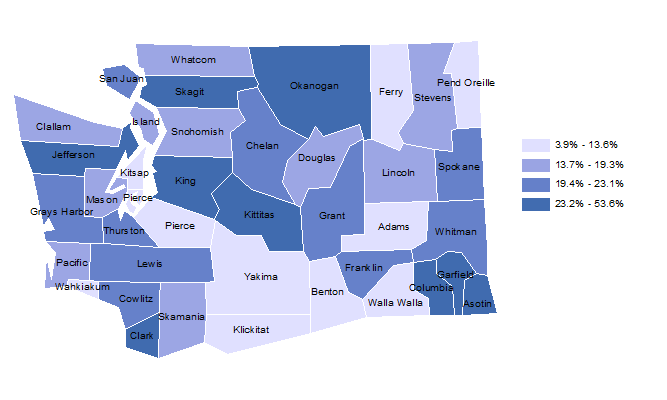
- Overall, between 2010 and 2022, the real average wage for Washington state increased by 27.5%. At the county level, the change ranged from 2.9% in Benton County to 40.9% in King County.
Data sources:
- U.S. Bureau of Economic Analysis
- Washington State Revenue Forecast Council - Implicit Price Deflator
E-mail: OFM.Forecasting@ofm.wa.gov
Last updated
Friday, May 17, 2024


