Washington and U.S. wage and salary employment
Wage & salary employment
| Year | Washington | U.S. |
|---|---|---|
| 2021 | 3,589,012 | 151,813,000 |
| 2020 | 3,494,303 | 147,228,000 |
| 2019 | 3,684,381 | 156,538,000 |
| 2018 | 3,609,102 | 154,362,000 |
| 2017 | 3,527,792 | 151,949,000 |
| 2016 | 3,451,985 | 149,960,000 |
| 2015 | 3,361,724 | 147,641,000 |
| 2014 | 3,281,055 | 144,722,000 |
| 2013 | 3,196,913 | 141,932,000 |
| 2012 | 3,129,397 | 139,619,000 |
| 2011 | 3,028,900 | 136,918,000 |
| 2010 | 2,997,266 | 135,393,000 |
| 2009 | 3,034,437 | 136,242,000 |
| 2008 | 3,177,384 | 142,584,000 |
| 2007 | 3,143,460 | 143,170,000 |
| 2006 | 3,073,003 | 141,660,000 |
| 2005 | 2,983,095 | 139,341,000 |
| 2004 | 2,913,982 | 137,404,000 |
| 2003 | 2,875,580 | 135,967,000 |
| 2002 | 2,866,055 | 136,301,000 |
| 2001 | 2,902,109 | 137,334,000 |
1980-2021
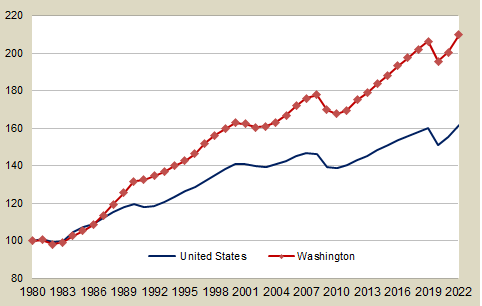
From 1980 through 2001:
- Wage and salary employment in Washington grew a total of 64.3% compared to 41.8% nationwide.
- Manufacturing jobs in Washington grew by 10.2%, while declining by 13.2% nationwide.
- Over 480,000 service jobs alone were added to Washington's labor market, many of these in business services and health care establishments.
From 2001 through 2021:
- From 2001 through 2007 wage and salary employment grew 8.7% in Washington, outpacing the nation's job growth of 4.5%.
- From 2007 through 2010 non-farm payrolls in Washington and nationwide fell by 5.9% and 5.6% respectively.
- The severity of the Covid-19 shutdowns resulted in annualized employment losses of 5.2% in Washington and 5.9% nationwide.
- The rebound from the Covid-19 shutdowns in 2021 resulted in annualized employment gains of 2.7% in Washington and 3.1% nationwide.
Data source:
E-mail: OFM.Forecasting@ofm.wa.gov
Last updated
Friday, August 18, 2023
