Manufacturing employment as a percent of total
Manufacturing employment as a percent of total, 1980
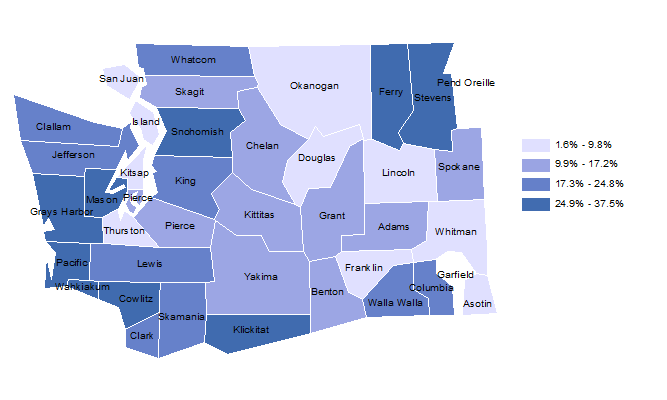
- State average: 17.8%
- Highest county: Wahkiakum at 37.5%
- Lowest county: Whitman at 1.6%
Manufacturing employment as a percent of total, 1990

- State average: 16.5%
- Highest county: Columbia at 35.3%
- Lowest county: Whitman at 1.4%
Manufacturing employment as a percent of total, 2000

- State average: 12.7%
- Highest county: Wahkiakum at 33.5%
- Lowest county: Douglas at 1.7%
Manufacturing Employment As a Percent of Total, 2022

- State average: 7.6%
- Highest county: Klickitat at 18.3%
- Lowest county: Garfield at 2.8%
Change in Total Manufacturing Employment, 2010-2022

- State average: 3.6%
- Highest County: Klickitat at 128.4% (an increase from 624 jobs to 1,425 jobs)
- Lowest County: Mason at -45.1% (a decrease from 306 jobs to 168 jobs)
Data source:
E-mail: OFM.Forecasting@ofm.wa.gov
Last updated
Friday, May 17, 2024
