


Understanding State Spending
In This Section
The state’s current operating budget for the 2025-27 biennium (from all fund sources) is $166 billion. A separate capital budget finances major building, renovation and land acquisition projects. The 2025-27 (non-transportation) capital budget for new projects provides $7.5 billion. An additional $7.4 billion is available in reappropriated funds to allow the completion of capital construction projects authorized in previous biennia. Roads, bridges, and other transportation capital projects are budgeted at $9.2 billion. (Total operating/capital budget = $185.1 billion)
Operating expenditures are supported by general state tax revenues, federal funds, dedicated tax and fee revenues, and other miscellaneous sources, such as earned interest and lottery receipts. The capital budget is primarily funded through general obligation bonds ($4.5 billion in 2025-27) and cash revenues from dedicated accounts. The debt service on non-transportation general obligation bonds is paid by GF-S resources in the operating budget.
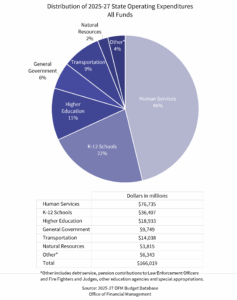
State operating expenditures can be grouped into seven broad categories of services:
- Human services, such as mental health and other institutions, public assistances, health care and correctional facilities.
- Public schools, which represent state support for kindergarten-through-grade 12 (K-12) education.
- Higher education in public universities, community colleges, and technical schools.
- Natural resources include expenditures for environmental protection and recreation.
- Transportation, which includes highway maintenance, state ferry operations and the Washington State Patrol.
- General government, including the administrative, judicial and legislative agencies.
- Other (miscellaneous) expenses, such as the payment of debt service and pension contributions for local law enforcement, firefighters, and judges.
The chart below shows the distribution of operating expenditures from all funds for the current biennium.
Approximately $70 billion of the state operating budget for 2025-27 is supported by GF-S tax and fee revenues and reserves. Because the Governor and Legislature have the greatest discretion over how these revenues are spent, programs supported by GF-S receive substantial attention during budget deliberations.
The following chart shows the distribution of estimated GF-S expenditures for the 2025-27 operating budget. The majority of the GF-S is spent on education, which includes the state share of funding for public schools (K-12), four-year colleges and universities, and two-year community and technical colleges.

The table below represents General Fund-State expenditures trends from the 1991-93 Biennium to the 2025-27 Biennium. The 2025-27 biennial amount is based on appropriations as of May 2025. The 2025-27 amount does not reflect $764 million in assumed under expenditures. Dollars have not been adjusted for inflation.

Legislation passed in 2009 merged six accounts into GF-S (Public Safety and Education, Equal Justice, Water Quality, Violence Reduction and Drug Enforcement, Student Achievement and Health Services accounts). Dollars in biennia prior to 2009–11 have not been adjusted for this merger.
For budget purposes, the number of state employees is measured in full-time equivalent (FTE) staff years (i.e., one person working 40 hours per week for a full year is counted as one FTE staff year). Two persons working half-time also count as one FTE. Although the state provides funding for compensation for local school teachers, this support is in the form of grants. Therefore, K-12 teachers are not considered state employees in statewide FTE counts.
The current state budget assumes approximately 138,109 FTEs on an annual basis, with the largest number of people employed in higher education institutions, correctional facilities, state social service and health agencies, and transportation agencies.
In addition to new policies adopted by the Governor, Legislature or federal government, the state budget can also be significantly influenced by demographic and economic factors. Differences in these “budget drivers” affect the cost of services or number of persons requiring services. An example of the demographic connection appears in K-12 education, where expenditures for the state’s constitutionally mandated responsibilities for basic education are closely tied to the number of school-age children in the state. Higher-than-average inflationary costs — such as those for medical expenses — also affect expenditures in the state budget. State expenditures are restricted to available revenues and governed by balanced budget requirements.