


Social-economic conditions
In This Section
Educational attainment
Population 25 Years and Over
- In 2022, 92.2% of Washington residents age 25 and above were high school graduates or equivalent.
- Washington state experienced a 103.3% increase in its population with a bachelor’s or higher degree between 2000 and 2022.
- In 2022 Washington ranked 12th among the 50 states in the percentage of persons 25 years and over holding a bachelor’s or higher degree.
| Year | HS’s degree or higher | Bachelor’s Degree or Higher |
|---|---|---|
| 2022 | 92.2% | 39.5% |
| 2010 | 89.7% | 31.0% |
| 2000 | 87.1% | 27.7% |
| 1990 | 83.8% | 22.9% |
| 1980 | 77.6% | 19.0% |
| 1970 | 63.5% | 12.7% |
Data source
Educational attainment (mapped by county)
Percent high school graduates
Population Age 25 and Above, 2022
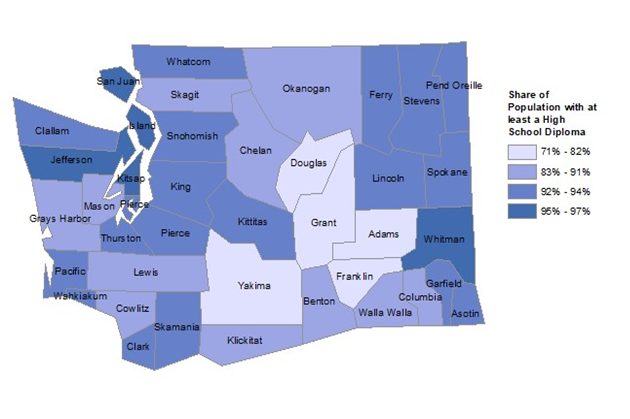
Jefferson (97.1%), Whitman (95.8%), San Juan (95.8%), and Island (95.7%) County had the highest percentages of high school graduates in the period between 2018-2022.
Adams (71.0%), Yakima (75.7%) and Franklin (75.8%) County had the lowest percentages of high school graduates in the period between 2018-2022.
Percent holding bachelor’s or higher degree
Population Age 25 and Above, 2022
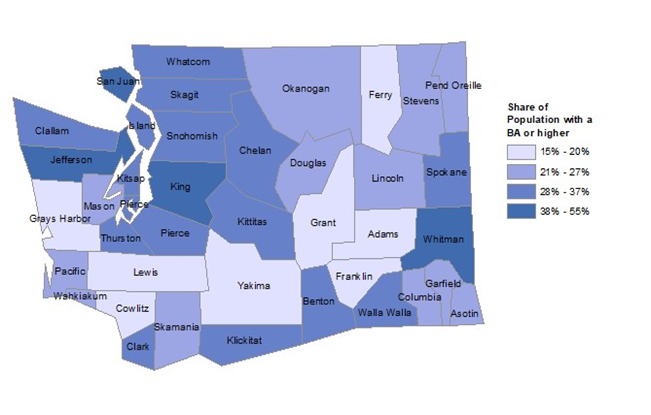
King (54.8%), San Juan (52.8%) and Whitman (50.9%) County had the highest percentages of residents age 25 and above holding bachelor’s or higher degrees in the period between 2018-2022.
Adams (14.7%), Grays Harbor (17.2%) and Cowlitz (16.6%) County had the lowest percentages of residents age 25 and above holding bachelor’s or higher degrees in the period between 2018-2022.
Data source
Families by household type
Percent of Families by Household Type
2022
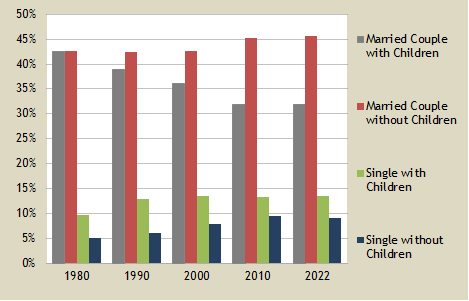
- Families with children are defined as families with at least one child under age 18 in the household.
- Between 1980 and 2021 the share of married-couple families with children has declined by 10.9% points.
- While the share of married-couple families with children has declined the share of single-parent families with children has increased.
| Family Type | Percent |
|---|---|
| Married Couple with Children | 31.9% |
| Married Couple without Children | 45.5% |
| Single with Children | 13.4% |
| Single without Children | 9.1% |
Data Source
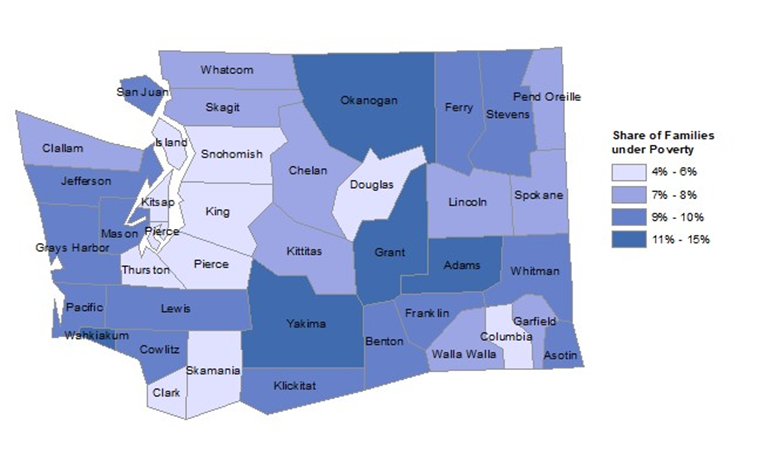
Families in Poverty
Families in poverty, families with children under age 18 in poverty, individuals in poverty, individuals age 65 and older in poverty
2022
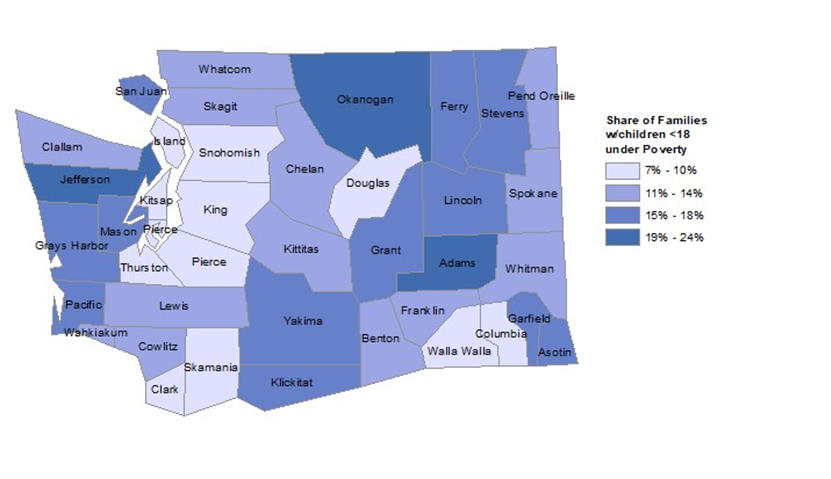
Families With Children Under Age 18 in Poverty
2022
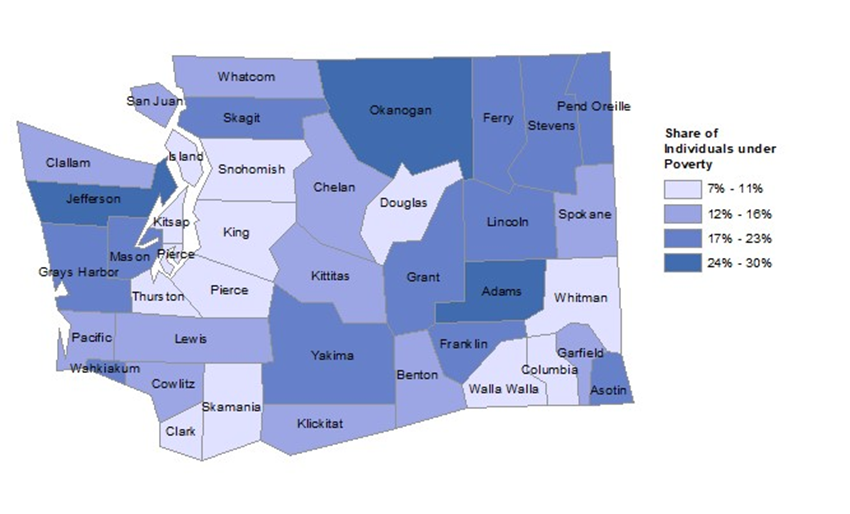
Individuals in Poverty
2022
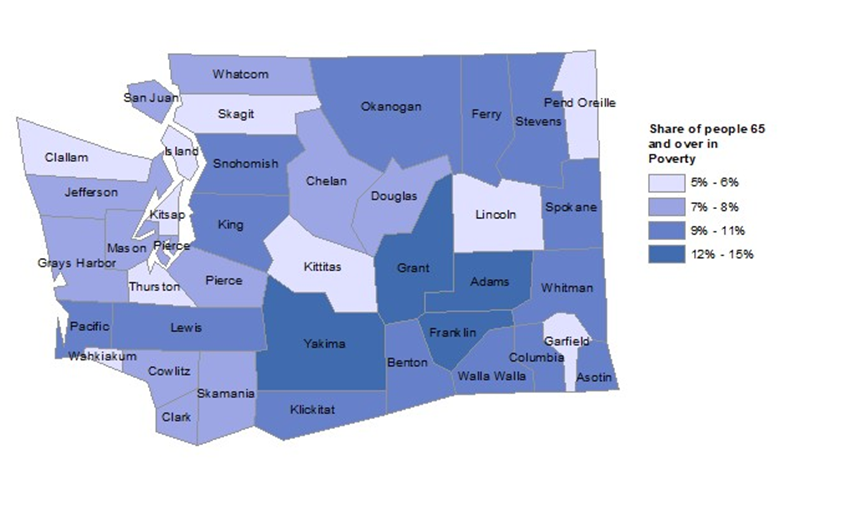
Individuals Age 65 and Older in Poverty
2022
Data source
Families in poverty by household type
American Community Survey 2020 (Based on 2020 income)
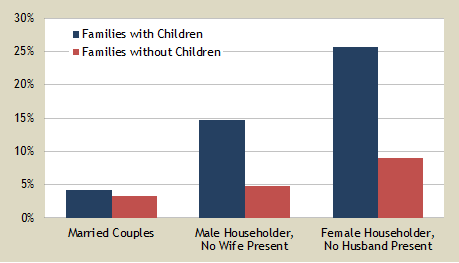
- The presence of children is associated with higher poverty rates for families.
- In 2022, the proportion of female-headed families with children living in poverty was 30.0%, considerably higher than the 9.3% of female-headed families without children present.
| Family Type | With Children |
Without Children |
|---|---|---|
| Married Couple | 4.2% | 3.2% |
| Male Householder, No Wife Present | 14.7% | 4.9% |
| Female Householder, No Husband Present | 25.7% | 9.0% |
Data source
Poverty rate for single-parent families headed by a female householder (mapped by county)
2022
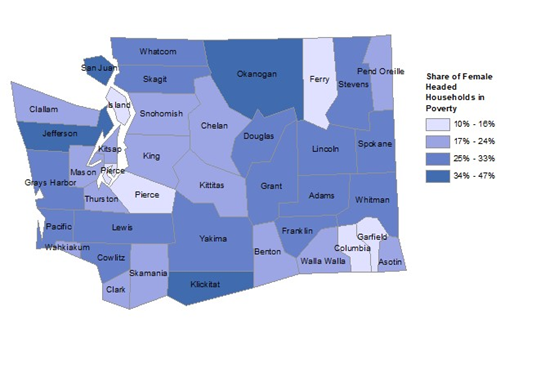
Klickitat and Jefferson County had the highest percentage of single mother families in poverty at 46.7% and 43.5%.
The lowest poverty rates for families headed by single mothers was found in Columbia and Ferry County at 12.4% and 15%.
Data source
Juvenile arrests for violent crimes
1982-2022
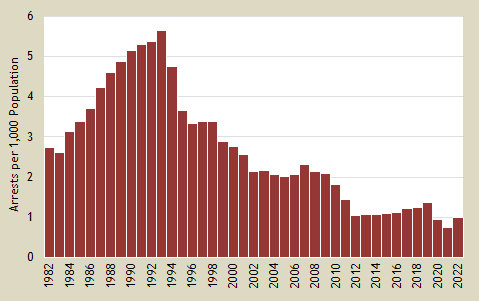
- The juvenile arrest rate for violent crimes fell quickly following its peak in 1993 and as of 2022 was 1.01 per thousand population.
- From 1993 to 2005 the arrest rate has declined to just under 2 arrests per 1,000 population.
| Year | Arrests |
|---|---|
| 2022 | 792 |
| 2021 | 575 |
| 2020 | 733 |
| 2019 | 1,032 |
| 2018 | 929 |
| 2017 | 904 |
| 2016 | 804 |
| 2015 | 779 |
| 2014 | 752 |
| 2013 | 750 |
| 2012 | 739 |
| 2011 | 1,016 |
| 2010 | 1,287 |
| 2009 | 1,491 |
| 2008 | 1,523 |
| 2007 | 1,650 |
| 2006 | 1,470 |
| 2005 | 1,416 |
| 2004 | 1,441 |
| 2003 | 1,513 |
| 2002 | 1,484 |
Data sources
Language spoken at home
Persons Living in Households Where Language Other Than English Is Spoken
Age 5 and Over
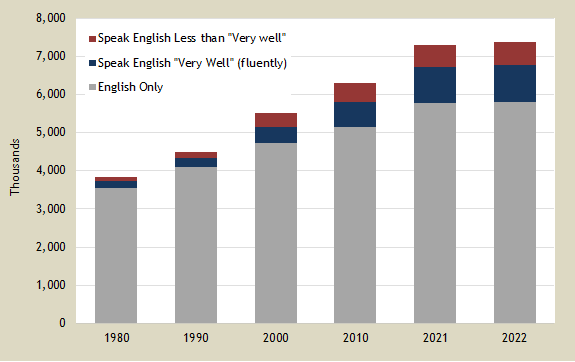
- The Census long form historically included questions about language(s) spoken at home and ability to speak English in the household. Those questions continue to be asked through the Census’ American Community Survey. Respondents are asked to report how well they speak English. Categories used for reporting are “very well,” “well,” “not well,” and “not at all.” Those reported to speak English less than “very well” are considered to have difficulty speaking English.
- The percent of the population age 5 and above living in households where a language other than English is spoken (not necessarily to the exclusion of English) increased steadily.
- The percent of the population age 5 and above living in households where English is spoken less than “very well” has risen from 2.7% in 1980 to 7.9% in 2021.
| Year | Percent |
|---|---|
| 2022 | 21.1% |
| 2010 | 18.3% |
| 2000 | 14.0% |
| 1990 | 9.0% |
| 1980 | 6.9% |
Data source
Related item
- America Speaks: A Demographic Profile of Foreign-Language Speakers for the United States: 2000 – U.S. Census Bureau
Languages spoken at home (mapped by county)
Percent in households where English is spoken less than “very well”
Population Age 5 and Above, 2022
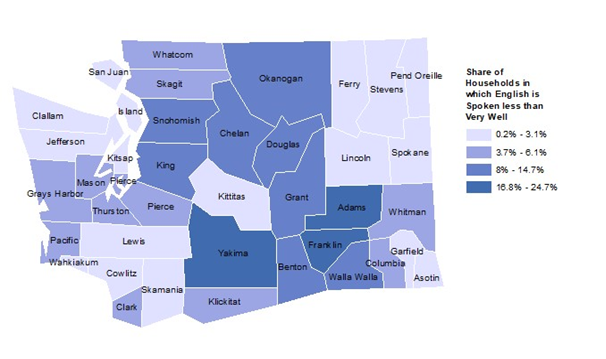
The smallest share of population where English was spoken less than “Very Well” was in Pend Oreille and Wahkiakum County at 0.2%. The highest share was in Adams County where 24.7% of persons were in this category.
Percent in households where language other than English is spoken
Population Age 5 and Above, 2022
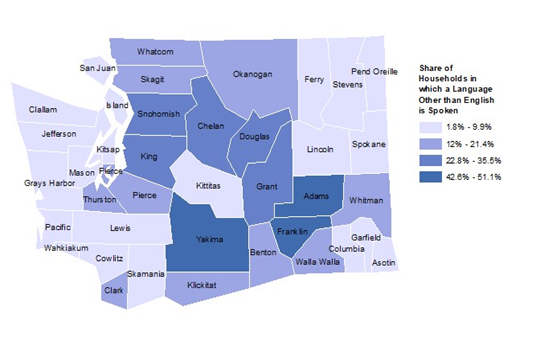
In Adams County 51.1% of persons lived in households where a language other than English was spoken. In both Lincoln and Pend Oreille County only 1% and 1.8% of persons were in this category.
Percent in households where Spanish is spoken
Population Age 5 and Above, 2022
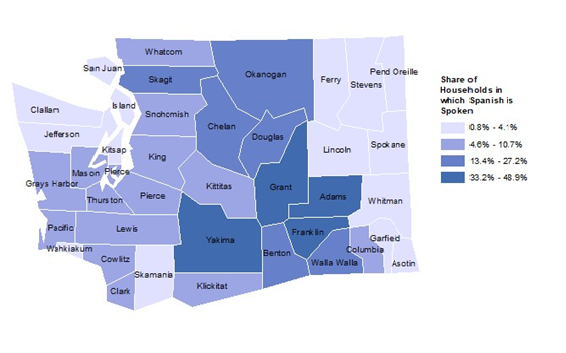
In Adams County 48.9% of persons lived in households where Spanish was spoken. In Ferry and Pend Oreille County are the lowest in this category with 1% and 0.8%.
Percent in households where Indo-European language other than Spanish is spoken
Population Age 5 and Above, 2022
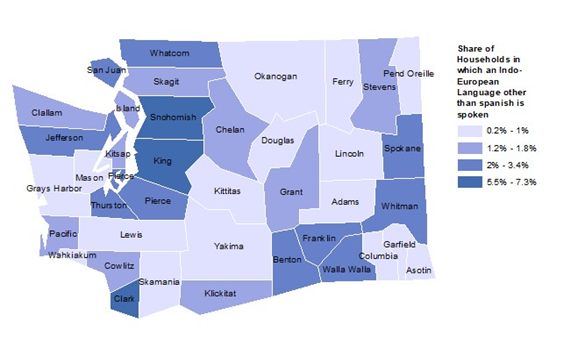
In King County 7.3% of persons lived in households where an Indo-European language other than Spanish was spoken. In Columbia County 0.2% of persons were living in households where an Indo-European language other than Spanish was spoken.
Percent in households where Asian or Pacific Island language is spoken
Population Age 5 and Above, 2022
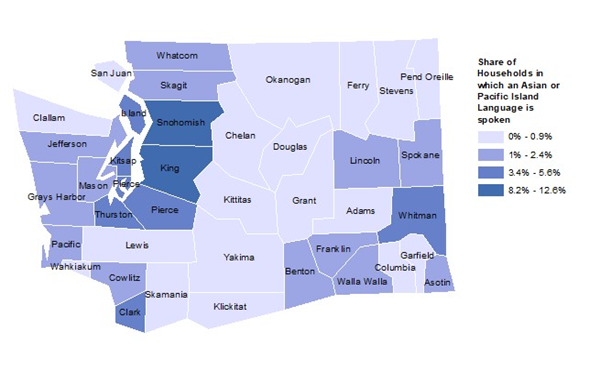
In King County 12.6% of persons lived in households where an Asian or Pacific Island language was spoken. In Columbia and Pend Oreille County only 0.1% and 0.3% of persons were in this category.
For more specific state and county data on population with limited English proficiency, on our website visit Limited English Proficiency Population Estimates.
Data source
One-parent and two-parent families
Families with Children Under 18 Headed by Single Parents
Families with Children Under 18
1960-2022
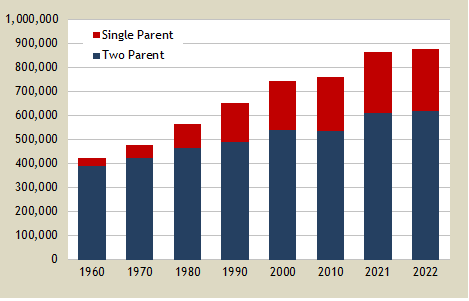
- Between 1960 and 2022, the share of families with children under 18 headed by single-parents increased from 8.2% to almost 29.6%.
- Between 2000 and 2022 the share of two-parent families declined by 21.8 percentage points.
| Year | Percent |
|---|---|
| 2022 | 29.6% |
| 2010 | 29.5% |
| 2000 | 27.1% |
| 1990 | 23.7% |
| 1980 | 19.2% |
| 1970 | 11.8% |
| 1960 | 8.2% |
Data source
Single-parent families as a percent of all families with children (mapped by county)
2022
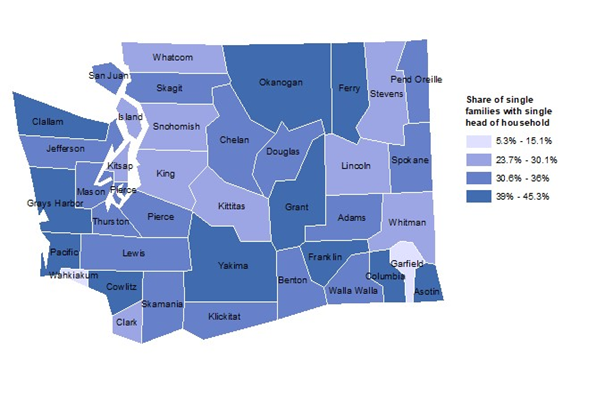
Columbia County had the highest percentage of single parent families with 45.3%.
Wahiakum County had the lowest share of single parent families, with 5.3%.
Data Sources
Population in poverty
Washington Percent of Population in Poverty
By Age Group, 1969-2022
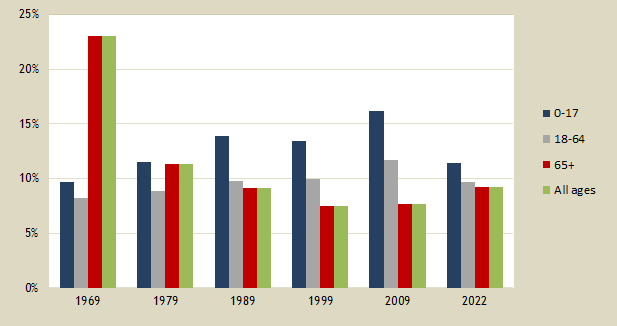
- The statewide poverty rate for the total population displayed almost no change over the 1990s, but spiked more recently because of the recession.
- Washington’s elderly population is the only group to show a significant long-term decline in poverty. In 1969, 23.0% of the elderly, more than one in five, lived in poverty. By 2022, following national trends, this percentage was 9.3%. The long-term decrease in poverty among persons age 65 and over is due to the expansion of Social Security and Medicare benefits and indexing those benefits io inflation.
| Age Group | Percent in Poverty |
|---|---|
| All Ages | 10.0% |
| Age 0-17 | 11.4% |
| Age 18-64 | 9.7% |
| Age 65+ | 9.3% |
Data source
Total births, and births to unmarried mothers
Percent of Births to Unmarried Mothers
1960-2021
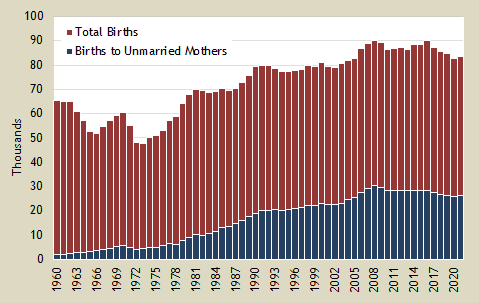
- Between 1960 and 2008, the share of births to unmarried mothers increased from 3.1 percent to over 33.8%.
- In 2021 births to unmarried mothers accounted for 31.5% of all births.
| Year | Percent |
|---|---|
| 2021 | 31.5% |
| 2020 | 31.5% |
| 2019 | 31.2% |
| 2018 | 31.0% |
| 2017 | 31.5% |
| 2016 | 31.6% |
| 2015 | 31.9% |
| 2014 | 31.9% |
| 2013 | 32.6% |
| 2012 | 32.3% |
| 2011 | 32.7% |
| 2010 | 32.9% |
| 2009 | 33.4% |
| 2008 | 33.8% |
| 2007 | 32.9% |
| 2006 | 31.6% |
| 2005 | 30.7% |
| 2004 | 30.2% |
| 2003 | 28.7% |