Other pages about the topic: County data
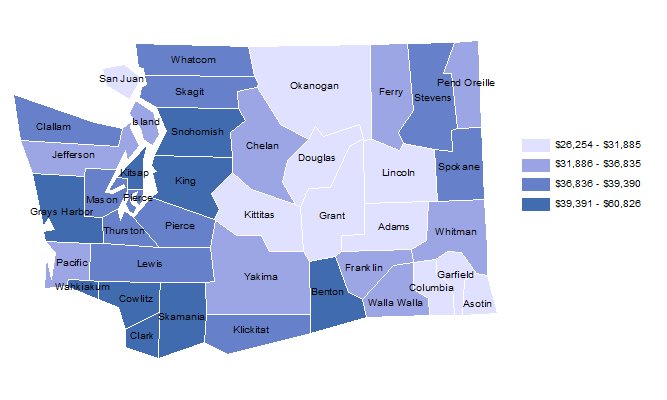
Average Wages, 1980
Inflation-Adjusted to 2022 Dollars
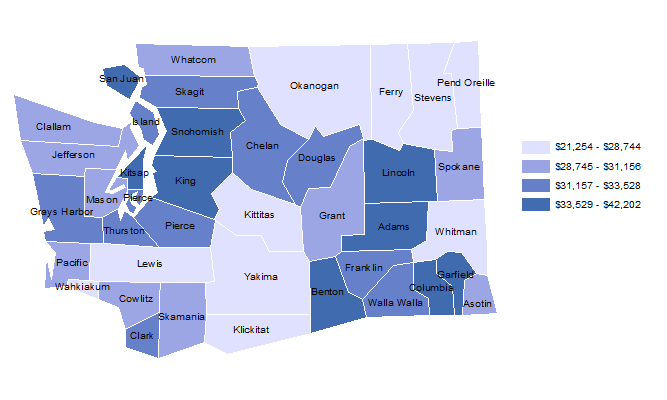
Per Capita Personal Income, 1980
Inflation-Adjusted to 2022 Dollars
Manufacturing employment as a percent of total, 1980
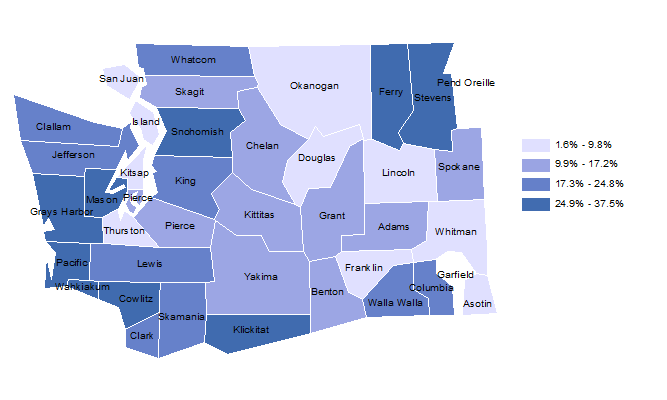
- State average: 17.8%
- Highest county: Wahkiakum at 37.5%
- Lowest county: Whitman at 1.6%
return to top
Population change
In accordance with RCW 43.62.035, the Office of Financial Management shall determine the percentage increase in population for each county over the preceding ten-year period, as of April 1.
Included here are documents describing the process of GMA projections.
Pages


