Washington population growth slowing
OLYMPIA – Washington state’s total population grew by an estimated 79,400 — to 8,115,100 as of April 1, 2025, according to annual estimates prepared by the Office of Financial Management.
Washington is growing, though it is doing so much slower than the annual average from last decade (79,400 in 2025 compared to 98,200 from 2010–20). The population is growing slower than last year, with an unadjusted growth rate of 1%. Looking at the current decade as a whole, the population has increased by 408,790 since April 1, 2020, which represents an increase of 5.3%.
Net migration (people moving in minus people moving out) is the largest driver of population growth, accounting for 78% of population growth (61,700 people, down 7,500 from last year). Except for the pandemic year 2021, this is the lowest level since 2013.
Components of State Population Change
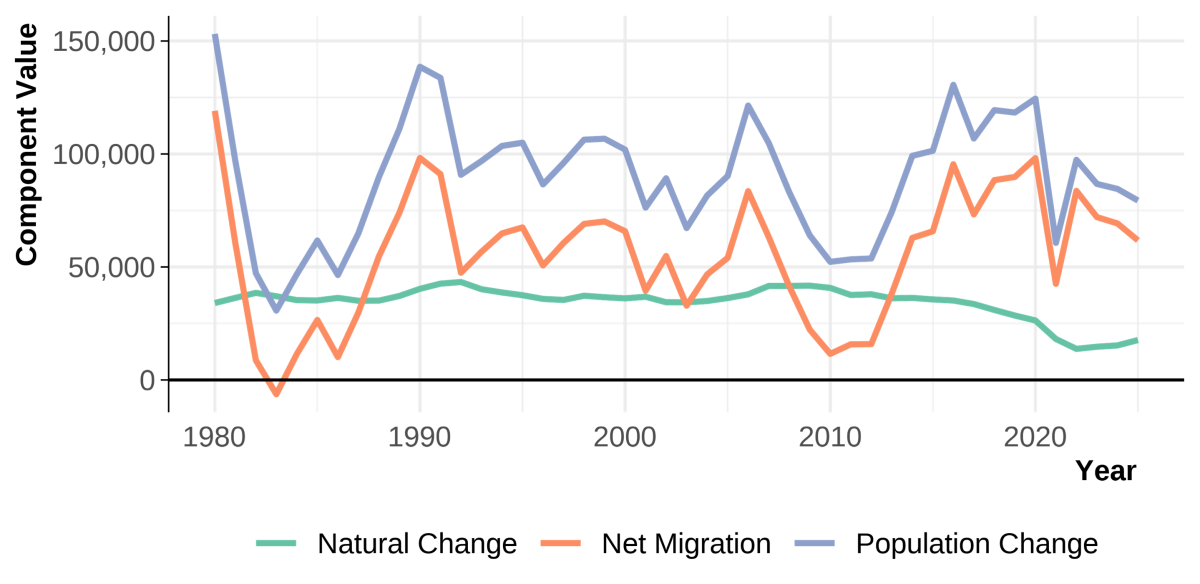
Birth rate continues to decline
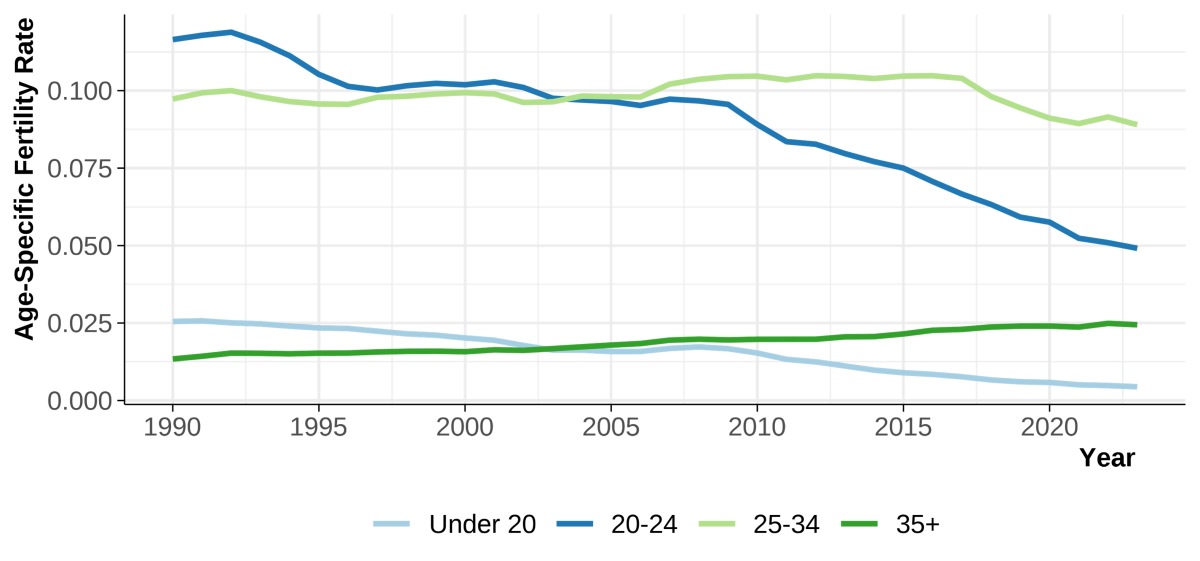
Natural change (births minus deaths) accounted for 22% of the annual growth or 17,700 people. Births have been trending downward statewide since around 2017, driven largely by decreases in the fertility rates of mothers in their teens and early 20s, as seen in this figure below. This decrease has not been offset by the increased fertility rates seen in mothers over age 35. Before and after the COVID-19 pandemic, deaths—the other side of natural change—have been trending upwards and will continue to do so as the baby boomer generation ages.
Age-Specific Fertility Rates by Age of Mother, 1990–2023
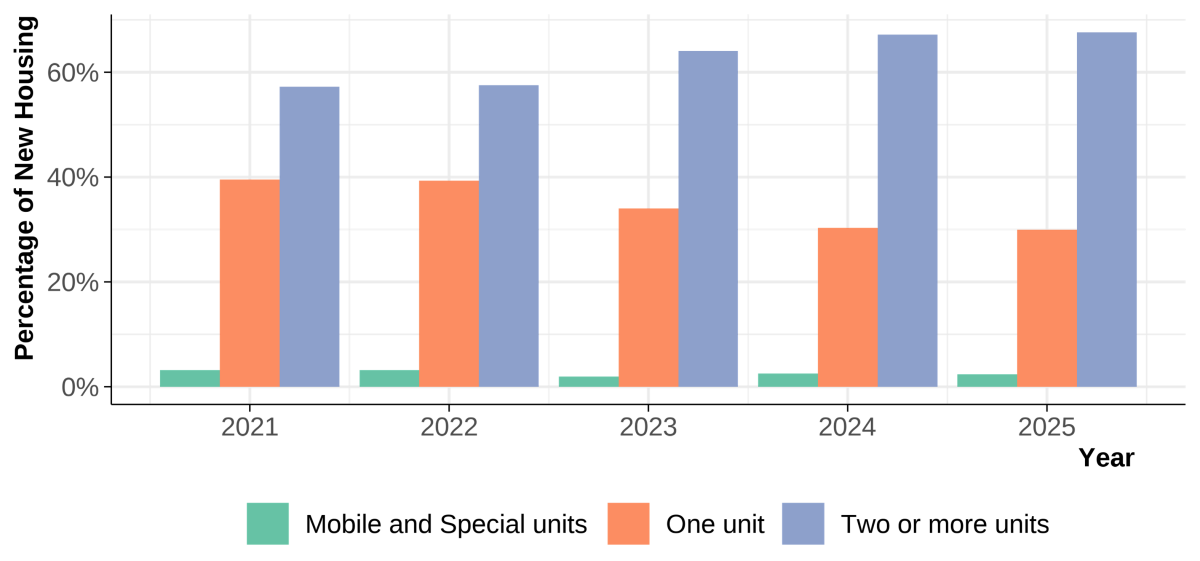
Strong housing growth continues
Washington continues to have strong housing growth. Over the past year, the state added 47,900 housing units, 4,300 less than the previous year.
- Of all new units built this past year, 68% were multi-family units, continuing the decade-long trend.
- More than 76% of all new housing units built within the past year were in one of the state’s five largest metropolitan counties — Clark, King, Pierce, Snohomish and Spokane.
- King County led all counties with 20,200 new housing units and represented 42% of the state’s total housing growth over the last year.
Washington continues to have strong population growth; however, in 2025 the population pressure that has been driving housing demand continues to ease as new units are completed and enter the housing supply.
Percentage of New Housing Units by Type, 2021-25
Where Washington is growing the most
Consistent with previous years, over 76% of state population growth occurred in the five largest metropolitan counties. The nine counties with populations between 100,000 and 350,000 saw 18% of the state’s growth. Counties with less than 100,000 had a 6% share, smaller than the previous year. Whitman (1.4%), King (1.4%) and Spokane (1.2%) were the three fastest growing counties.
The April 1, 2025, population estimate for Washington’s incorporated cities and towns is 5,350,840, an increase of 1.2% from the previous year. The top 10 cities for numeric change, in descending order, are Seattle, Tacoma, Bellevue, Vancouver, Redmond, Shoreline, Spokane, Spokane Valley, Auburn and Marysville. Seattle’s population increased by 18,900 people, for a total of 816,600. Strong housing growth was the main driver of population growth for these cities.
Population milestones
Significant milestones for cities and counties this year include:
- Yakima city reached 100,000 residents.
- Marysville reached 75,000 residents.
- College Place reached 10,000 residents.
- La Conner reached 1,000 residents.
- Cowlitz County now has a population density of over 100 people per square mile.
- Walla Walla County is over 50 people per square mile.
Why these estimates matter
Population estimates are the foundation of numerous analyses and reports which help us learn about Washington and who lives here. OFM county and city population estimates are used for the distribution of roughly $220 million in state funding to local governments each year. Other uses for these estimates include:
- forming the foundation of numerous state planning and data products.
- monitoring caseloads and track resources.
- helping to target delivery of health care services and monitor disease spread.
- assisting in planning for housing and environmental protection.
How OFM estimates population
OFM population estimates are developed using a variety of state and local government data. They are based on the most recent federal census counts with annual change added by monitoring changes in births, deaths, housing supply, school enrollment, voter registrations, motor vehicle registrations and employment.
You can find additional information on the latest population estimates for the state, counties, cities and towns on OFM’s website.
A PDF version of this release includes components of population change for each county as well as Washington's top 25 cities by population change.


