Other pages about the topic: Forecasting & Research
Average wages
Inflation-adjusted to 2022 dollars
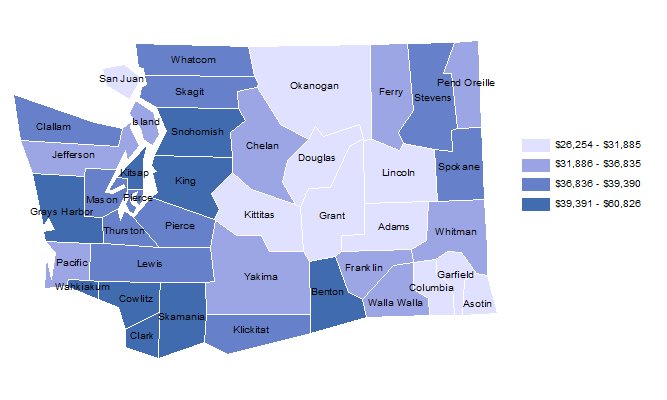
Average Wages, 1980
Inflation-Adjusted to 2022 Dollars
Value of Washington exports
2022 ($ Millions)
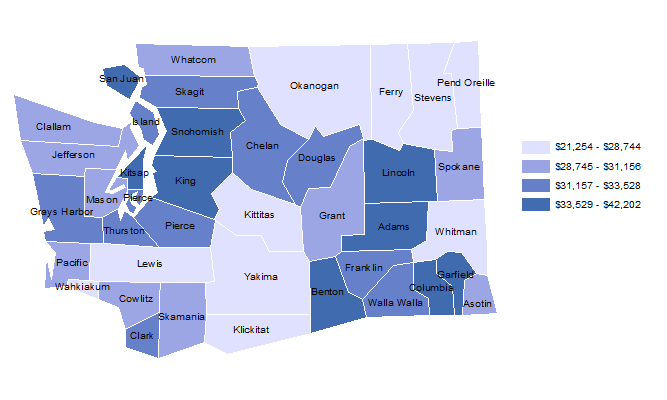
Per Capita Personal Income, 1980
Inflation-Adjusted to 2022 Dollars
Manufacturing employment as a percent of total, 1980
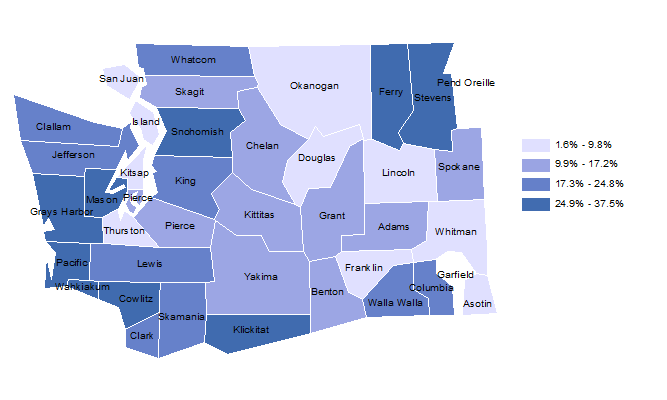
- State average: 17.8%
- Highest county: Wahkiakum at 37.5%
- Lowest county: Whitman at 1.6%
return to top
2023-2025
Budget
Driver |
Projected
Change |
Budget
Share* |
Juvenile
Rehabilitation
(Ages 12-17) |
1.0% |
0.4% |
Corrections
(Males Ages 18-39) |
0.6% |
4.5% |
Pages


