Higher education expenditures per capita
Washington State & Local Government Higher Education Expenditures Per Capita
Inflation-Adjusted to 2022 Dollars
| Fiscal Year | Expenditures Per Capita |
|---|---|
| 2022 | $1,006 |
| 2021 | $1,060 |
| 2020 | $1,085 |
| 2019 | $987 |
| 2018 | $1,167 |
| 2017 | $1,168 |
| 2016 | $1,149 |
| 2015 | $1,089 |
| 2014 | $1,069 |
| 2013 | $1,090 |
| 2012 | $1,064 |
| 2011 | $1,101 |
| 2010 | $1,067 |
| 2009 | $1,152 |
| 2008 | $1,111 |
| 2007 | $1,062 |
| 2006 | $1,062 |
| 2005 | $1,029 |
| 2004 | $1,039 |
| 2003 | N/A |
| 2002 | $1,002 |
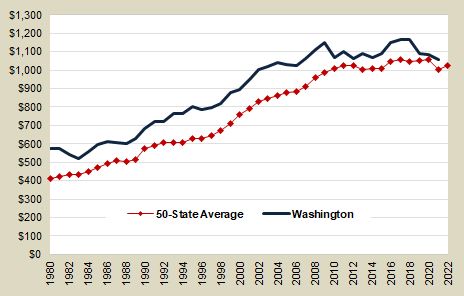
- Washington government per capita spending on higher education has consistently been above the U.S. average.
- In fiscal year 2022, Washington ranked 24th among the 50 states in per capita state and local government spending on higher education.
Data sources:
- U.S. Census Bureau: State and Local Government Finances
- U.S. Census Bureau: National and State Population Estimates
- Washington State Economic and Revenue Forecast Council - inflation adjustment
E-mail: OFM.Forecasting@ofm.wa.gov
Last updated
Friday, January 3, 2025


