State & local government revenues per capita
Washington state & local government revenues per capita
Inflation-Adjusted to 2022 Dollars
| Fiscal Year |
Revenues Per Capita |
|---|---|
| 2022 | $10,765 |
| 2021 | $10,409 |
| 2020 | $10,314 |
| 2019 | $10,315 |
| 2018 | $10,104 |
| 2017 | $9,584 |
| 2016 | $9,060 |
| 2015 | $9,642 |
| 2014 | $8,419 |
| 2013 | $8,262 |
| 2012 | $8,098 |
| 2011 | $8,102 |
| 2010 | $7,933 |
| 2009 | $8,072 |
| 2008 | $8,654 |
| 2007 | $8,551 |
| 2006 | $8,050 |
| 2005 | $7,714 |
| 2004 | $7,588 |
| 2003 | NA |
| 2002 | $7,377 |
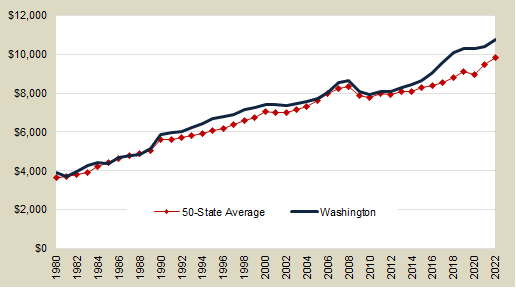
- Revenues include fees, charges for services, and interest earnings as well as taxes. See State & Local Government Revenue Sources for a breakdown of revenues into individual sources.
- In fiscal year 2022, Washington ranked 12th among the 50 states in state and local government revenues per capita.
Data sources:
E-mail: OFM.Forecasting@ofm.wa.gov
Last updated
Friday, January 3, 2025


