K-12 education expenditures per capita
Washington state & local government K-12 education expenditures per capita
| Fiscal Year | Expenditures Per Capita (Inflation-Adjusted to 2020 Dollars) |
|---|---|
| 2022 | $2,769 |
| 2021 | $2,852 |
| 2020 | $2,908 |
| 2019 | $2,891 |
| 2018 | $2,663 |
| 2017 | $2,465 |
| 2016 | $2,408 |
| 2015 | $2,200 |
| 2014 | $2,120 |
| 2013 | $2,045 |
| 2012 | $2,119 |
| 2011 | $2,122 |
| 2010 | $2,168 |
| 2009 | $2,280 |
| 2008 | $2,242 |
| 2007 | $2,128 |
| 2006 | $2,063 |
| 2005 | $2,099 |
| 2004 | $2,114 |
| 2003 | N/A |
| 2002 | $2,062 |
Inflation-Adjusted to 2022 Dollars
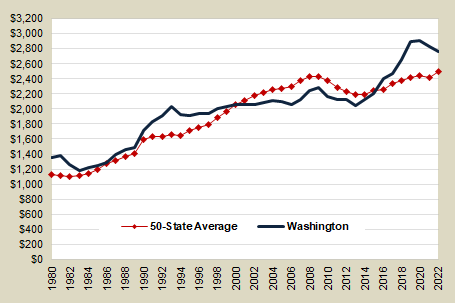
- In 2000, Washington ranked 15th among the states in state and local government K-12 education spending per capita. In fiscal year 2022 Washington was ranked 12th.
Data sources:
- U.S. Census Bureau: State and Local Government Finances
- U.S. Census Bureau: National and State Population Estimates
- Washington State Economic and Revenue Forecast Council - inflation adjustment
E-mail: OFM.Forecasting@ofm.wa.gov
Last updated
Friday, January 3, 2025


