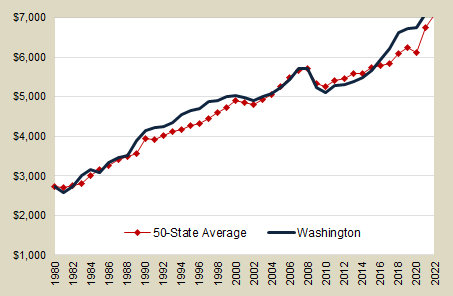
State & local government taxes per capita
Washington state & local government taxes per capita
Inflation-Adjusted to 2022 Dollars
| Fiscal Year |
Taxes per capita |
|---|---|
| 2022 | $7,437 |
| 2021 | $7,105 |
| 2020 | $6,750 |
| 2019 | $6,719 |
| 2018 | $6,610 |
| 2017 | $6,207 |
| 2016 | $5,952 |
| 2015 | $5,661 |
| 2014 | $5,480 |
| 2013 | $5,393 |
| 2012 | $5,305 |
| 2011 | $5,279 |
| 2010 | $5,109 |
| 2009 | $5,220 |
| 2008 | $5,705 |
| 2007 | $5,705 |
| 2006 | $5,441 |
| 2005 | $5,222 |
| 2004 | $5,077 |
| 2003 | NA |
| 2002 | $4,912 |

- In fiscal year 2022, Washington ranked 14th among the 50 states in total state and local taxes per capita.
- In fiscal year 2022, Washington ranked 1st in per capita state and local sales tax collections among all states, just behind Hawaii, highlighting Washington's heavy dependence on general and selective sales taxes in its tax structure.
- Of the 13 western states, Washington ranked 4th in per capita state and local taxes in fiscal year 2022. California and Hawaii had higher per capita state and local taxes.
- State comparisons of state & local taxes per capita are available from the Washington Department of Revenue's Comparative State and Local Taxes.
Data sources:
E-mail: OFM.Forecasting@ofm.wa.gov
Last updated
Friday, January 3, 2025


