


Budget drivers
In This Section
Change in medical costs
1995-2024
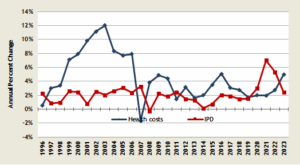
- Health care, including employee health insurance and medical assistance, is over 20% of the general fund budget.
- The size of the health care budget, combined with the rapid growth in per capita health care costs, make this a prime source of pressure on spending.
- Except for a brief period in the mid-1990s and during the recession in 2008 and during this recent COVID-19 pandemic period, health care costs have grown much faster than general inflation as measured by the Implicit Price Deflator (IPD) for personal consumption.
- Beginning in 2002, cost shifts from employers to employees resulted in much of the decrease in growth of employer medical costs.
- More recent employer cost control efforts have included generic drug preferences, care management incentives, high-deductible consumer-directed health plans, and health savings accounts (HSAs).
- In fiscal year 2024, health care costs for state and local employees grew more than twice as fast as the overall inflation reflected in the economy.This highlights that health care is a significant driver of rising expenses for state and local governments, outpacing the general price increases of goods and services.
| Year | Change |
|---|---|
| 2024 | 5.0% |
| 2023 | 2.7% |
| 2022 | 2.0% |
| 2021 | 2.0% |
| 2020 | 1.7% |
| 2019 | 2.8% |
| 2018 | 3.1% |
| 2017 | 5.1% |
| 2016 | 3.5% |
| 2015 | 2.0% |
| 2014 | 1.6% |
| 2013 | 3.1% |
| 2012 | 1.5% |
| 2011 | 4.4% |
| 2010 | 4.9% |
| 2009 | 3.9% |
| 2008 | -1.7% |
| 2007 | 7.9% |
| 2006 | 7.7% |
| 2005 | 8.4% |
| 2004 | 12.0% |
Data Sources
- Office of Financial Management
- U.S. Department of Labor, Bureau of Labor Statistics
- Bureau of Economic Analysis
E-mail: OFM.Forecasting@ofm.wa.gov
Income assistance (AFDC/TANF) caseload
Income assistance (AFDC/TANF)
Compared to Population Under Age 18
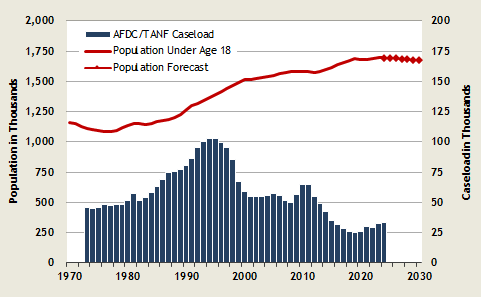

- With the implementation of welfare reform in 1997, Temporary Assistance to Needy Families (TANF) caseloads dropped dramatically, despite the growing population of children under 18 years old. The share of children in TANF household declined to 3.3% in fiscal year 2024 from 7.0% in fiscal year 2011. The share of children in TANF households remained unchanged from fiscal year 2023 to fiscal year 2024.
- The population of infants in TANF households, which had been growing through fiscal year 2010, flattened in fiscal years 2011 and began trending down thereafter. The share of infants in TANF households declined to 4.5% in fiscal year 2024 from 12.2% in fiscal year 2010. The share of infants in TANF households increased by 0.2% from fiscal year 2023 to fiscal year 2024.
- The increase in the AFDC caseload in the 1990s was a result of welfare reforms of that era, which stressed the need to prepare clients for work. Nationally it was known as the Family Support Act. In Washington, the program was known as the Family Independence Program (FIP).
- Policy changes implemented in February 2011 were responsible for majority of the decline in subsequent caseloads.
| Fiscal Year |
Average Monthly Caseload |
|---|---|
| 2024 | 33,122 |
| 2023 | 32,645 |
| 2022 | 28,843 |
| 2021 | 29,701 |
| 2020 | 26,182 |
| 2019 | 25,424 |
| 2018 | 26,031 |
| 2017 | 28,557 |
| 2016 | 31,287 |
| 2015 | 35,160 |
| 2014 | 42,572 |
| 2013 | 48,679 |
| 2012 | 54,436 |
| 2011 | 65,140 |
| 2010 | 64,451 |
| 2009 | 56,461 |
| 2008 | 50,121 |
| 2007 | 51,939 |
| 2006 | 55,523 |
| 2005 | 57,026 |
| 2004 | 55,610 |
Data sources
E-mail: OFM.Forecasting@ofm.wa.gov
Juvenile rehabilitation institutional population
Compared to Age 12 to 17 Population
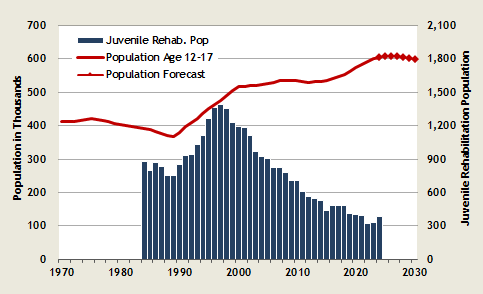

- The decrease in juvenile rehabilitation institutional population reflects, in part, the decline in juvenile arrests for violent crimes over the past two decades.
- Additionally, evolving legislation required that older juveniles charged with serious violent offenses be tried as adults, though their sentences may be different from adults. This shifted some of the juveniles who would have been committed to Juvenile Rehabilitation facilities to the jurisdiction of the Department of Corrections.
| Fiscal Year |
Average Monthly Population |
|---|---|
| 2024 | 388 |
| 2023 | 334 |
| 2022 | 324 |
| 2021 | 390 |
| 2020 | 405 |
| 2019 | 415 |
| 2018 | 486 |
| 2017 | 487 |
| 2016 | 483 |
| 2015 | 438 |
| 2014 | 533 |
| 2013 | 550 |
| 2012 | 566 |
| 2011 | 611 |
| 2010 | 704 |
| 2009 | 707 |
| 2008 | 779 |
| 2007 | 827 |
| 2006 | 829 |
| 2005 | 905 |
| 2004 | 925 |
Data sources
E-mail: OFM.Forecasting@ofm.wa.gov
Kindergarten through grade 12 (K-12) enrollment
K-12 Enrollment
Including Running Start
Compared to Age 5 to 17 Population
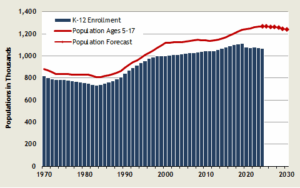
 K-12 enrollment usually tracks well with the population age 5 to 17. Moderate variations occur due to trends in the attractiveness of private and/or home schooling.
- The number of school-age children increased an average of 10,970 per year between 2014 and 2024.
- Remote learning policies to mitigate the spread of the Covid-19 virus in 2020 resulted in numerous parents enrolling their children in alternative in-person teaching arrangements. As a result, public enrollment declined over the next serveral school years even as the school-age population continued to grow. K-12 enrollment decreased by 0.3%, while the population age 5 to 17 increased by 0.3%.
| Year | October Headcount Enrollment |
|---|---|
| 2024 | 1,071,082 |
| 2023 | 1,074,395 |
| 2022 | 1,077,339 |
| 2021 | 1,074,262 |
| 2020 | 1,077,739 |
| 2019 | 1,115,732 |
| 2018 | 1,107,127 |
| 2017 | 1,103,393 |
| 2016 | 1,092,384 |
| 2015 | 1,079,434 |
| 2014 | 1,067,555 |
| 2013 | 1,055,895 |
| 2012 | 1,047,953 |
| 2011 | 1,045,088 |
| 2010 | 1,045,241 |
| 2009 | 1,039,664 |
| 2008 | 1,032,105 |
| 2007 | 1,026,458 |
| 2006 | 1,026,530 |
| 2005 | 1,025,041 |
| 2004 | 1,017,594 |
Data sources
E-mail: OFM.Forecasting@ofm.wa.gov
Medical assistance caseload
Compared to Total Population
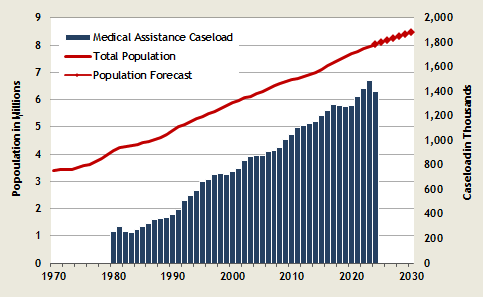
There have been several significant policy changes that have impacted the Medical Assistance caseload:
- July 2007 – Cover All Kids expands health care coverage eligibility.
- July 1988: First Steps expansion for children and pregnant women.
- July 1994: Expansion to 200% federal poverty level (FPL) for children.
- The Affordable Care Act made it possible for the potential enrollment of over 300,000 newly eligible low-income individuals to the medical assistance caseload. That has since expanded to over 686,000 potential individuals in fiscal year 2024. Their budgetary impact is moderated because federal matching funds currently pick up 90% of the cost. More will be added to this tally in the future as the federal matching rates decline.
- For the first time since 2020, the medical assistance caseload has decreased, showing a year-over-year decline of 5.98%.
| Fiscal Year | Average Monthly Caseload |
|---|---|
| 2024 | 1,399,413 |
| 2023 | 1,488,429 |
| 2022 | 1,427,678 |
| 2021 | 1,361,556 |
| 2020 | 1,288,075 |
| 2019 | 1,276,737 |
| 2018 | 1,288,885 |
| 2017 | 1,289,802 |
| 2016 | 1,243,903 |
| 2015 | 1,203,654 |
| 2014 | 1,156,549 |
| 2013 | 1,136,194 |
| 2012 | 1,125,384 |
| 2011 | 1,107,763 |
| 2010 | 1,052,649 |
| 2009 | 1,004,894 |
| 2008 | 940,683 |
| 2007 | 914,900 |
| 2006 | 913,070 |
| 2005 | 880,788 |
| 2004 | 875,363 |
Data sources
E-mail: OFM.Forecasting@ofm.wa.gov
Prison inmate population
Compared to Age 18 to 39 Male Population
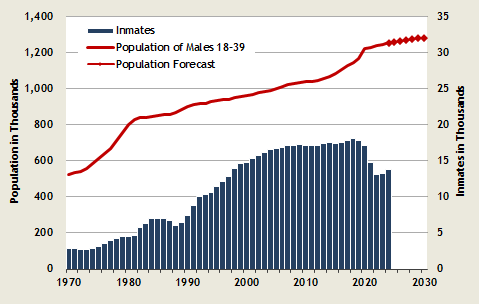
- From 1970 through 1988, the prison inmate population closely tracked the population group most susceptible to incarceration — males age 18-39.
- The Sentencing Reform Act stabilized and lowered the prison caseload in the mid- to late 1980s, while new policies, including an emphasis on drug crimes beginning in the late 1980s had a dramatic impact on the size of the prison population.
- In 1995, the “I-593 Hard Time for Armed Crime” Initiative created new and separate weapon enhancements for firearm findings and for deadly weapon findings. In 1998 the sentencing rules were clarified so that weapon findings were mandatory, not eligible for earned release time and to be served consecutive to the sentence of the underlying offense and to any other weapon enhancements.
- A separate drug grid and drug seriousness levels were established for drug offenses occurring on or after July 2003. This specialized grid reduced the sentencing lengths and scoring for certain drug sentences.
- 2007 – Offender Reentry Initiative is implemented and expected to reduce future inmate caseloads through education, work force skills, and treatment programs.
- Recent legislation requires some juveniles charged with serious violent offenses to be tried as adults, shifting some juveniles to the jurisdiction of the Department of Corrections from the Juvenile Rehabilitation Administration.
- The recent declines in inmate population are driven by lower than projected admissions and an increase in releases as a result of SB 5164 and the Washington State Supreme Court decision
in State v. Blake. These required courts to resentence individuals serving Life without Parole due to Robbery 2 and those with possession convictions in their criminal history, respectively.
The impact of these shorter confinement sentences has been a caseload reduction.
| Fiscal Year | June Inmate Population |
|---|---|
| 2024 | 13,714 |
| 2023 | 13,254 |
| 2022 | 13,138 |
| 2021 | 14,725 |
| 2020 | 17,111 |
| 2019 | 17,766 |
| 2018 | 18,035 |
| 2017 | 17,868 |
| 2016 | 17,578 |
| 2015 | 17,433 |
| 2014 | 17,502 |
| 2013 | 17,404 |
| 2012 | 17,087 |
| 2011 | 17,058 |
| 2010 | 17,096 |
| 2009 | 17,295 |
| 2008 | 17,104 |
| 2007 | 17,121 |
| 2006 | 16,808 |
| 2005 | 16,663 |
| 2004 | 16,563 |
Data sources
E-mail: OFM.Forecasting@ofm.wa.gov
Projected change in budget driver populations
2023-2025
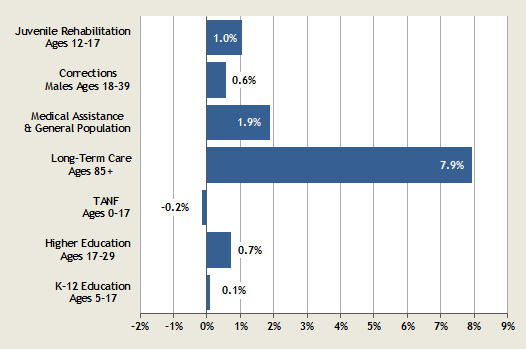
- Among the populations that receive a significant share of state government services, those 85 and above (Long Term Care) are projected to grow rapidly through the forecast period.
| Budget Driver |
Projected Change |
Budget Share* |
|---|---|---|
| Juvenile Rehabilitation (Ages 12-17) |
1.0% | 0.4% |
| Corrections (Males Ages 18-39) |
0.6% | 4.5% |
| Medical Assistance (General Population) |
1.9% | 10.7% |
| Long-Term Care (Ages 85+) |
7.9% | 6.9% |
| TANF (Ages 0-17) |
-0.2% | 1.8% |
| Higher Education (Ages 17-29) |
0.7% | 6.0% |
| K-12 Education (Ages 5-17) |
0.1% | 51.1% |
Data source
E-mail: OFM.Forecasting@ofm.wa.gov
Public higher education enrollment
Compared to Prime College-Age Population
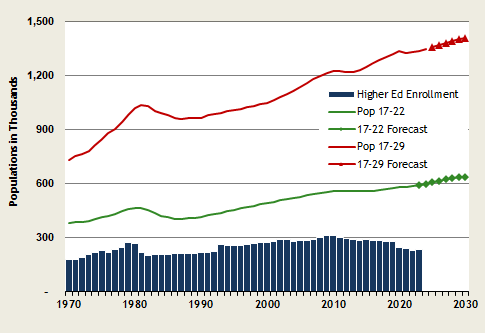
- Demographic pressures on higher education have been strong since the children of Baby Boomers reached college age.
- A flattening of prime college-age populations encompassed much of the 2010 – 2020 period, even as the older student population continued to rise.
- While most institutions have experienced declining enrollment, with the University of Washington being the exception, the bulk of that decline has been in the community and technical colleges.
- Fall 2023 enrollment in public higher education enrollment grew by 2% compared to fall 2022. This increase was driven by enrollment in community and technical colleges that grew by 5% year-over-year. Fall 2023 enrollment in 4-year institutions continued to decline but at a slower pace, -1% year-over year vs -4% year-over-year in fall 2022.
| Year | Fall Headcount Enrollment |
|---|---|
| 2023 | 235,023 |
| 2022 | 231,470 |
| 2021 | 239,930 |
| 2020 | 246,850 |
| 2019 | 279,458 |
| 2018 | 282,594 |
| 2017 | 283,648 |
| 2016 | 284,476 |
| 2015 | 288,215 |
| 2014 | 285,955 |
| 2013 | 288,593 |
| 2012 | 293,720 |
| 2011 | 301,696 |
| 2010 | 313,334 |
| 2009 | 311,743 |
| 2008 | 303,487 |
| 2007 | 291,907 |
| 2006 | 286,230 |
| 2005 | 283,160 |
| 2004 | 279,911 |
| 2003 | 288,057 |
Data source
E-mail: OFM.Forecasting@ofm.wa.gov
State government FTEs compared to population
State Government Employment Including Higher Education
Operating and Capital Budget
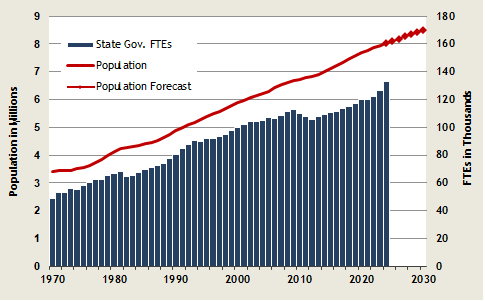
- The number of full-time equivalent (FTE) state employees has generally tracked closely with growth in the state’s total population.
- While total population growth is a reasonable indicator of demand for state government services, growth of select population groups may further drive up demand for specific services like higher education, public assistance, or prisons.
- The moderation in State Government full-time equivalent employment since 2009 has been a result of general revenue impacts in the aftermath of the “great” recession.
- Since rebounding in 2013, state government full-time equivalent employment reached a level in 2020 pre-covid that exceeded its pre-recession peak (2009) by 6.9%.
- State government FTEs increased by 5.58% in FY 2024 compared to FY 2023, reflecting efforts to meet the demands of a growing population. The state’s population grew by 1.06%, indicating that the increase in FTEs outpaced population growth.
| Fiscal Year |
State Government FTEs |
|---|---|
| 2024 | 133,251 |
| 2023 | 126,205 |
| 2022 | 121,948 |
| 2021 | 119,834 |
| 2020 | 120,293 |
| 2019 | 116,895 |
| 2018 | 114,988 |
| 2017 | 113,731 |
| 2016 | 111,204 |
| 2015 | 110,537 |
| 2014 | 108,893 |
| 2013 | 107,568 |
| 2012 | 105,920 |
| 2011 | 107,494 |
| 2010 | 109,973 |
| 2009 | 112,546 |
| 2008 | 111,420 |
| 2007 | 108,693 |
| 2006 | 106,641 |
| 2005 | 106,769 |
| 2004 | 105,077 |
Data source
E-mail: OFM.Forecasting@ofm.wa.gov
State-supported child care
Children Receiving State-Subsidized Child Care
Compared to Population Age 12 & Under
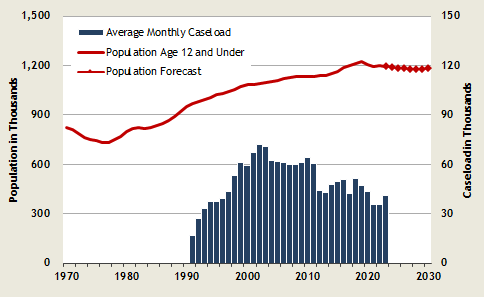
- The average monthly caseloads shown here include children receiving subsidized child care in Child Care Development Fund programs as well as Therapeutic Child Care and child care through Adoption Support.
- Most state-subsidized child care is for children under 13. Children age 13 to 18 are eligible for subsidies if they are physically or mentally incapable of caring for themselves or are under court supervision.
- Declining caseloads in fiscal year 2012 and 2013 were partially a result of policy changes implemented between October 2010 and March 2011.
- Increases in fiscal years 2014 and 2015 resulted from the reversal of the 2010 and 2011 policy changes.
- With the advent of “stay at home” directives to help mitigate the COVID-19 pandemic, the demand for child care fell in FY 2020 and FY 2021.
- The number in children in household receiving subsidized care is above pre-pandemic levels. With the rebound in the economy, and the return of folks to more normal work situations, the number of child care enrollees increased 17.8% year-over-year in fiscal year 2024, following a 14.8% year-over-year in fiscal year 2023.
| Fiscal Year |
Average Monthly Caseload |
|---|---|
| 2024 | 48,076 |
| 2023 | 40,818 |
| 2022 | 35,557 |
| 2021 | 35,496 |
| 2020 | 43,700 |
| 2019 | 47,265 |
| 2018 | 51,464 |
| 2017 | 42,466 |
| 2016 | 29,828 |
| 2015 | 49,575 |
| 2014 | 47,622 |
| 2013 | 42,700 |
| 2012 | 43,798 |
| 2011 | 60,314 |
| 2010 | 64,127 |
| 2009 | 61,113 |
| 2008 | 64,419 |
| 2007 | 64,287 |
| 2006 | 65,849 |
| 2005 | 66,861 |
| 2004 | 67,298 |
Data sources
E-mail: OFM.Forecasting@ofm.wa.gov
State-supported nursing home caseload
State-Supported Nursing Home and Home & Community Services Caseloads
(average monthly)
Compared to Elderly Population
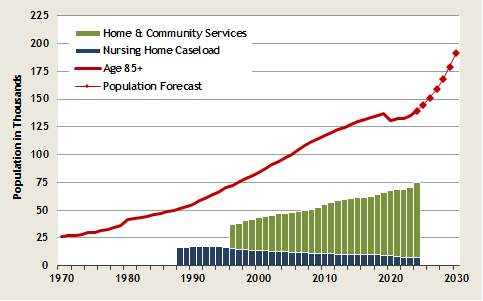
- State-supported nursing home beds are limited by policy.
- State-supported nursing home beds have not kept pace with the growth of the population aged 85 and above. However, increasingly the elderly population is being served by in-home, assisted care facilities, and community-based programs.
- The population of those 85 and above will grow very quickly as the Baby Boom cohort ages.
- The sharp decline in 85+ population in 2020 was likely caused by COVID-19 related deaths.
- From fiscal year 2020 to fiscal year 2023, the state-supported nursing home caseload has declined by 22%. In fiscal year 2024, state-supported nursing home caseload increased slighltly 1.5% year-over-year.
| Fiscal Year |
Nursing Home Caseload |
Home & Community Services |
|---|---|---|
| 2024 | 7,736 | 66,798 |
| 2023 | 7,616 | 62,657 |
| 2022 | 7,629 | 61,130 |
| 2021 | 7,969 | 60,571 |
| 2020 | 9,214 | 58,463 |
| 2019 | 9,635 | 56,240 |
| 2018 | 9,706 | 54,440 |
| 2017 | 9,775 | 52,619 |
| 2016 | 9,915 | 52,846 |
| 2015 | 10,032 | 51,577 |
| 2014 | 10,150 | 50,065 |
| 2013 | 10,231 | 49,034 |
| 2012 | 10,324 | 48,139 |
| 2011 | 10,596 | 46,038 |
| 2010 | 10,866 | 44,080 |
| 2009 | 10,993 | 41,779 |
| 2008 | 11,288 | 39,506 |
| 2007 | 11,767 | 38,094 |
| 2006 | 12,153 | 37,041 |
| 2005 | 12,310 | 35,481 |
| 2004 | 12,671 | 34,635 |
Data sources
E-mail: OFM.Forecasting@ofm.wa.gov